“The Tweezer Bottom candlestick pattern is a combination of two candle patterns that signify bullish sentiment in the market and show the potential reversal after a downtrend. The formation of this pattern is like that the second candle in the bottom pattern may also be either bullish or bearish (no matter), but it may revisit the previous candle’s low, without breaking it and create the same low”
In this article, we understand how the Tweezer Bottom candlestick is formed and how we can make trading decisions with this pattern using technical analysis.
Table of Contents
Introduction
The Tweezer Bottom candlestick pattern is a two-candle pattern as you might have guessed from its name, Some people use this candlestick in their trading as a bullish sign to identify potential buying opportunities in financial markets, as it suggests that sellers may be losing momentum and buyers are starting to take control. The pattern is treated as a bullish reversal, but only when it appears under certain conditions. So in this article, we discuss all the important points and master this pattern.
In this article, we are going to take an in-depth analysis and look at a very popular and common pattern – the tweezer bottom pattern – what it means when this pattern shows up on your chart, and how to trade on it also we cover all the important points.
What is the Tweezer Bottom Candlestick Pattern?
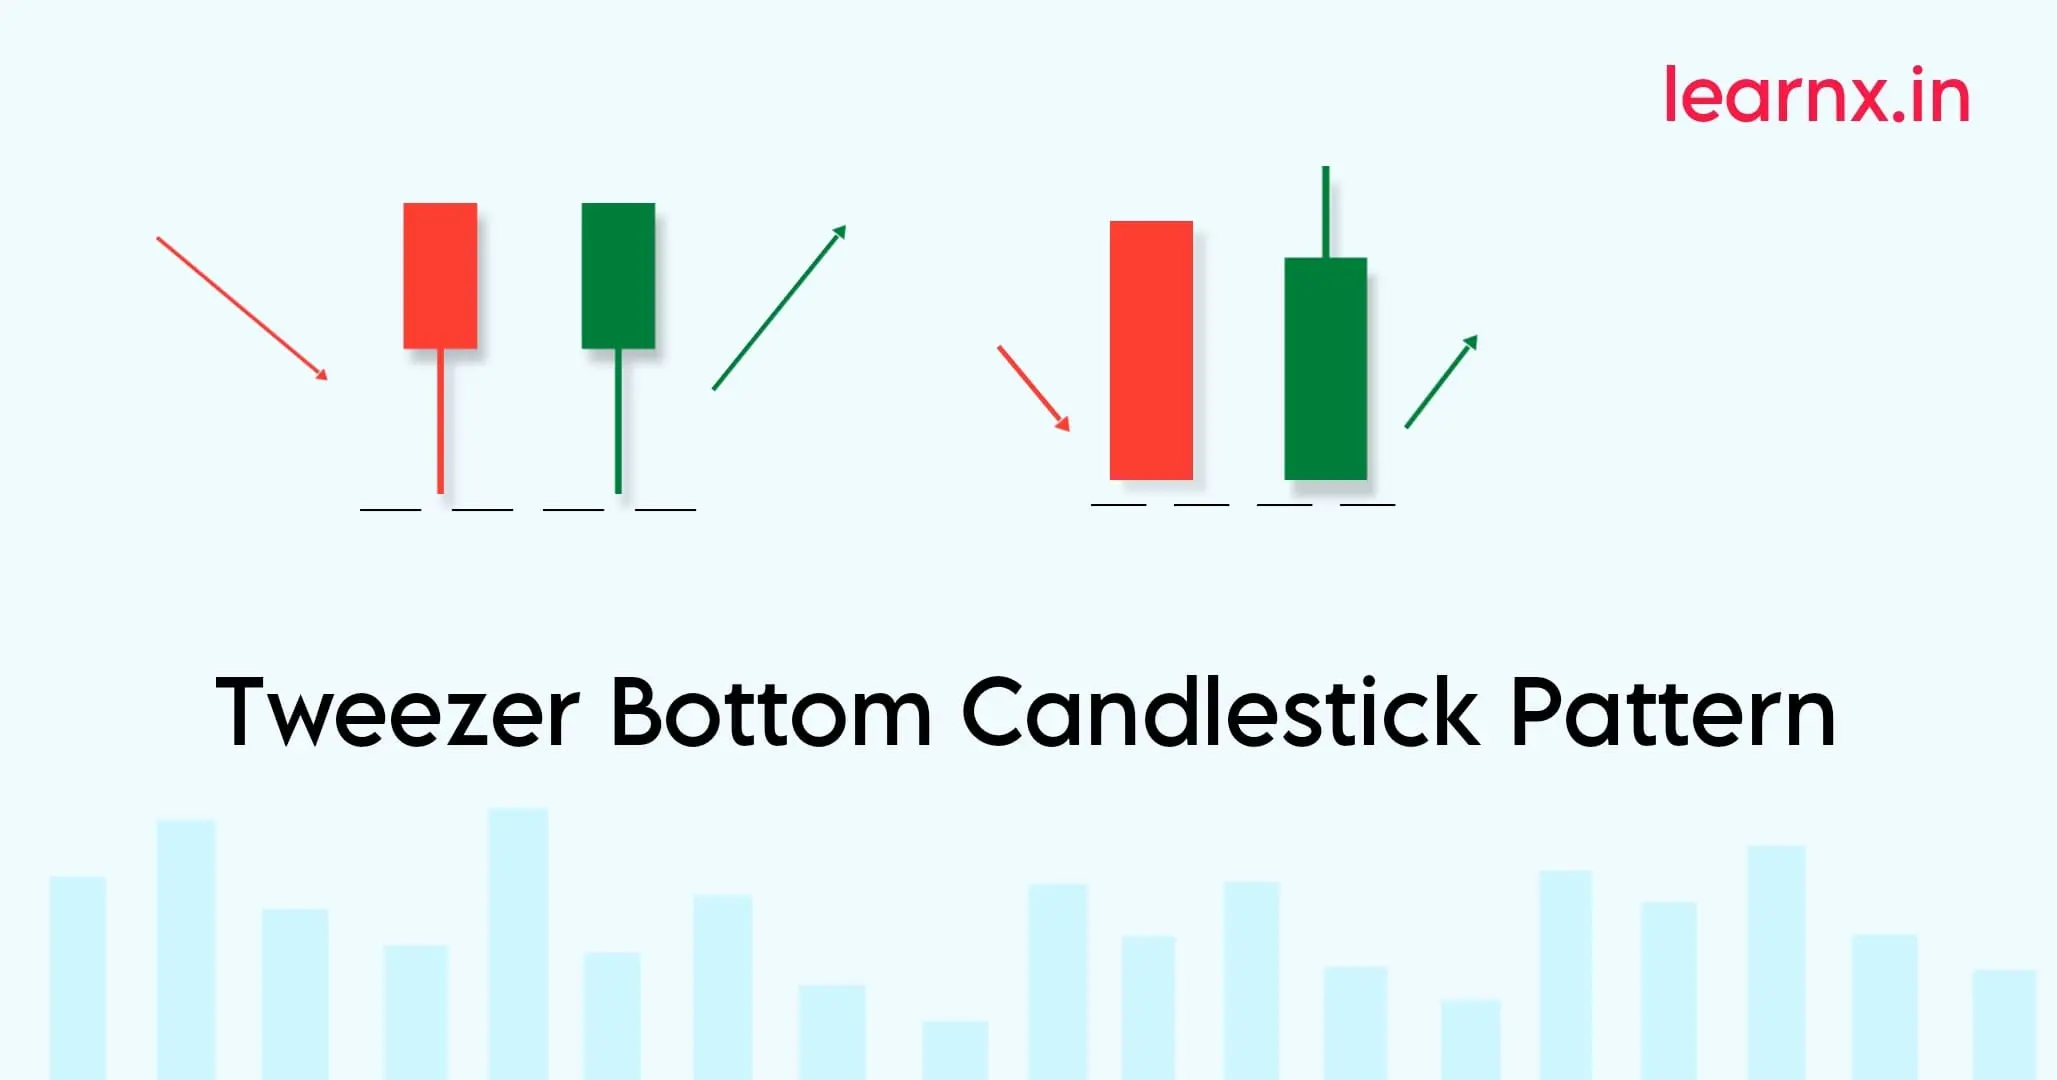
Image 1: Basics of Tweezer Bottom Candlestick Pattern.
The Tweezer Bottom is a bullish reversal candlestick pattern that occurs at the bottom of a downtrend and signals a potential reversal of the bottom of the trend.
The pattern consists of two candles, the first one is a bullish green candle and the other one is a bearish red candle, in which the bullish candle and the bearish candle formed have equal lows or nearly equal highs but in this pattern low is most important where the candle form if this candle is formed in the horizontal support this candle give best result.
There can be a few variations of this pattern, as shown by the illustration above, but just we tell you the main overall characteristic shared between all variations is that both candles have the same or similar lows reversal.
The matching of the candle’s bottoms is usually composed of wicks (or Shadows) but can be the candle’s bodies as well.
This candle indicates clearly that bulls will not allow the prices to reduce further.
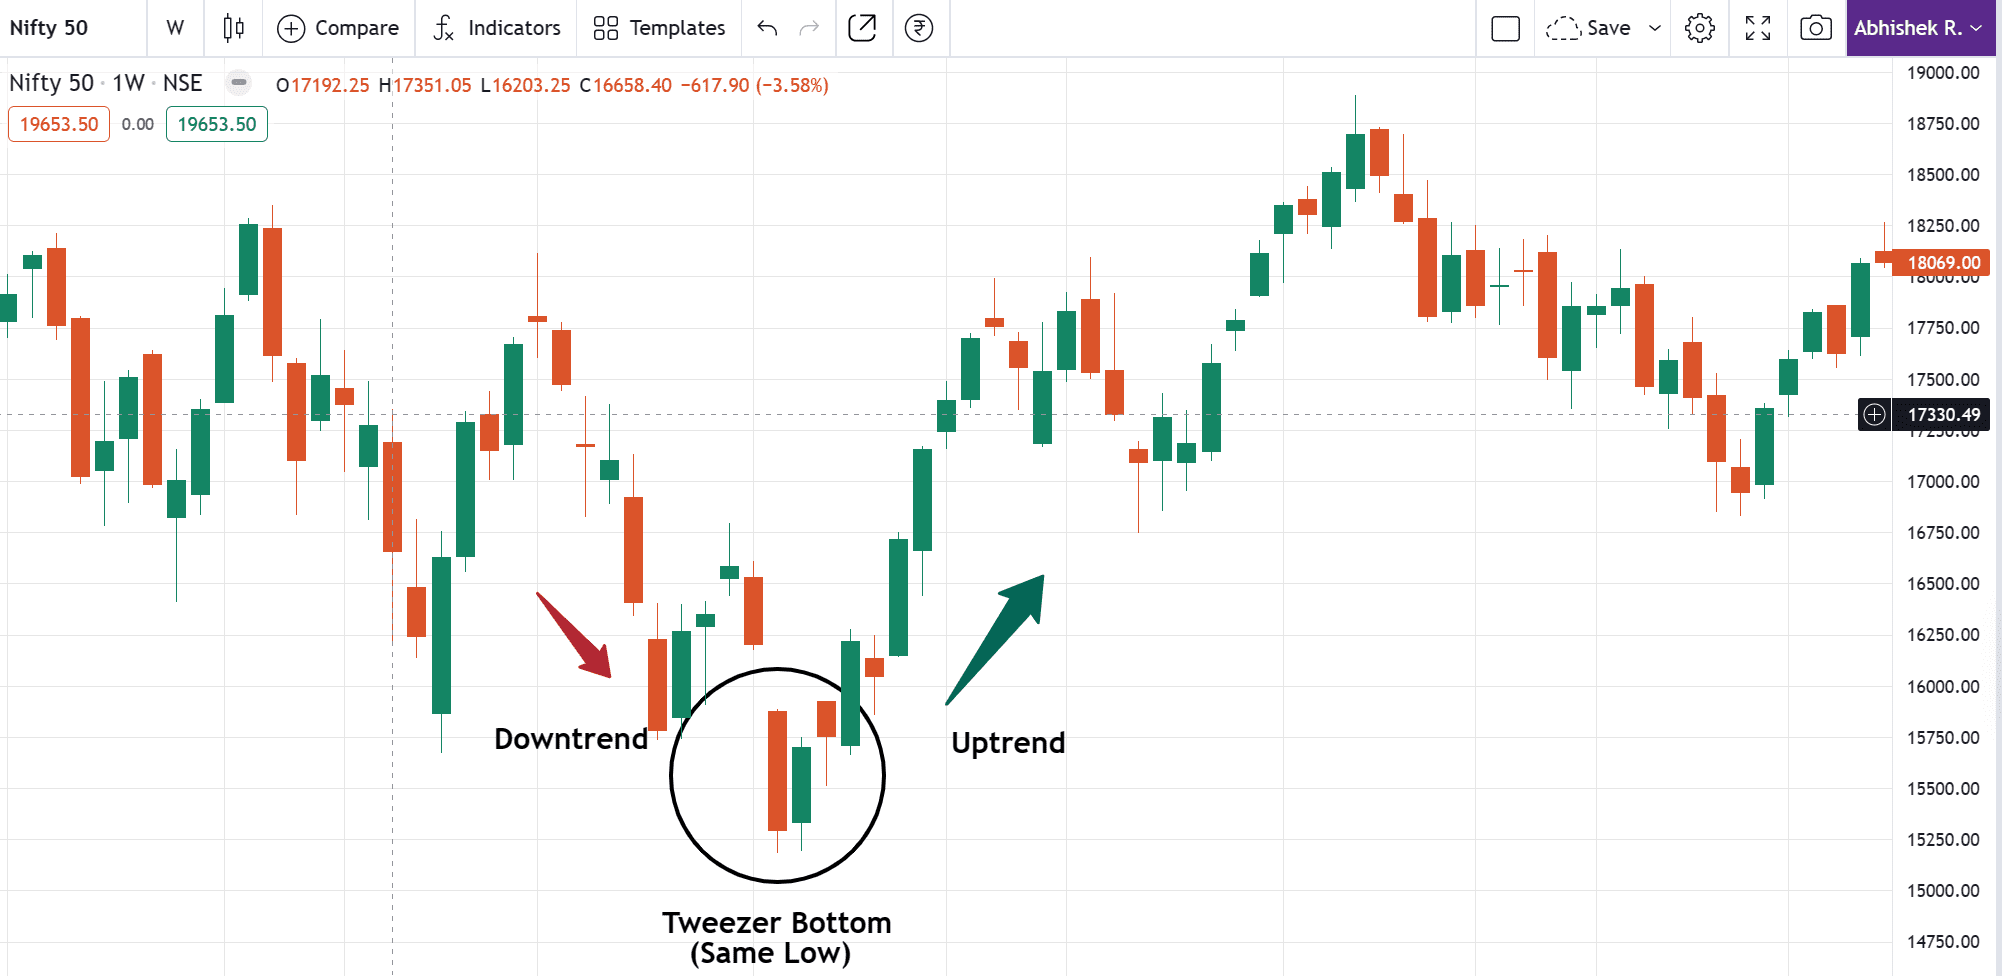
To get a clear idea about the Tweezer Bottom pattern and what it looks like, please refer to all the Images in this article with practical knowledge so you can find them easily.
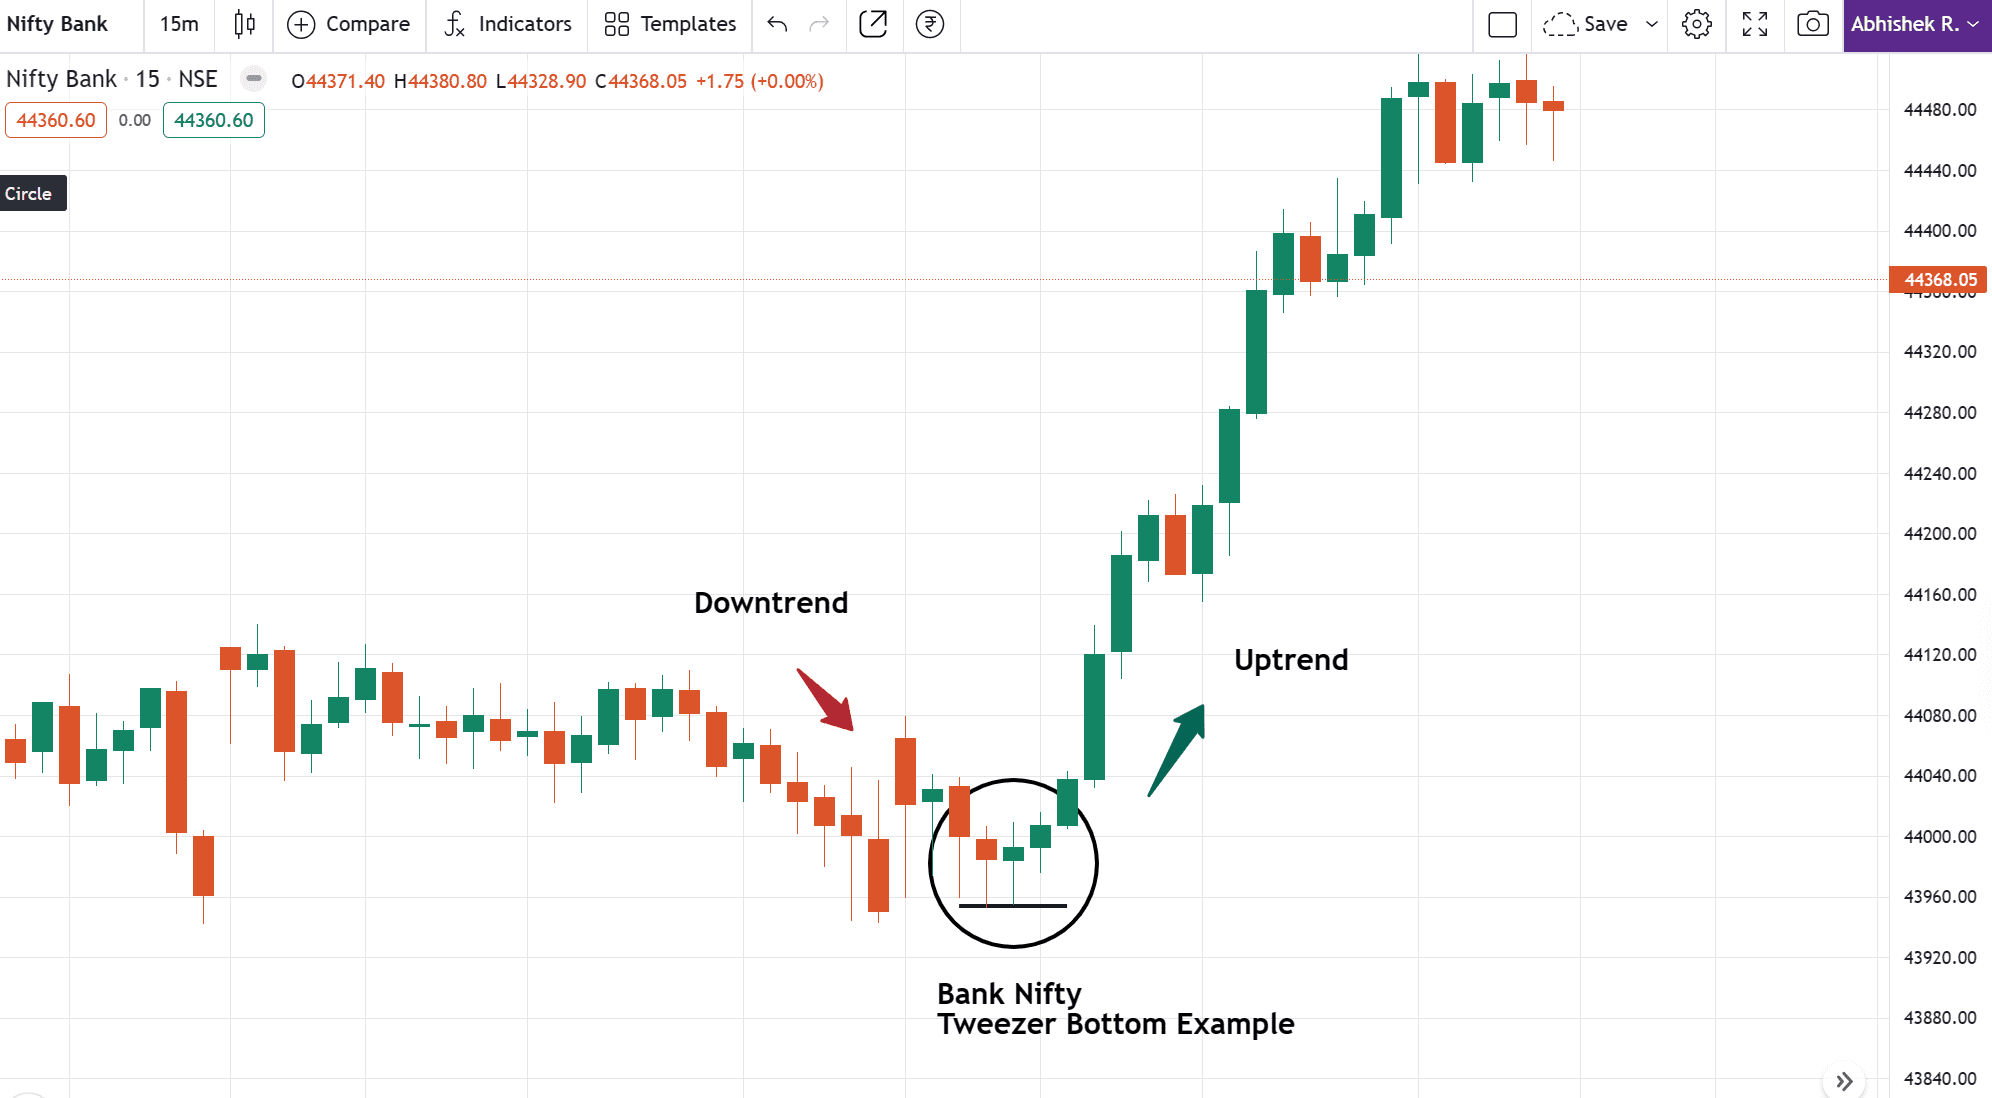
Understanding Tweezer Bottom Candlestick Pattern with Example
Image 2: Example in Bank Nifty Index chart.


When identifying this pattern, you should note the following points for best results:
How to identify:
- First, find the clear downtrend in the market.
- There must be two or more consecutive candles of either color but creating the same lows at the bottom without breaking it.
- The second candle opens at or near the same level as the previous candle’s close.
- Note: If this pattern is followed by another reversal pattern, such as a Double bullish hammer, Bullish Engulfing or Piercing Line pattern, with identical lows, it is even more reliable to get the best risk-reward ratio.
Trade Guide:
Entry: At the Tweezer bottom candlestick pattern, traders can enter a long position after the close of a second candle of the pattern formed. (for better results enter on third candle when breaking these two candles high.)
Stop loss: In this pattern, stop-loss order below the lowest point of the pattern to limit their risk profile and secure capital if the signal fails or is trappy.
Target: The target for a trade can be placed with a good risk-reward ratio like 1:2 or at the resistance level.
Note: Tweezer bottom patterns have an accuracy of around 80-90% as per our research, so other patterns give you a better risk reward.
Tweezer Bottom Candlestick Trading Strategy Guide
Image 1: Identify the Pattern Correctly.
Image 2: Horizontal Support + Tweezer Bottom Candlestick Strategy.
Image 3: Technical Analysis of Tweezer Bottom Candlestick [ Improved ]
Limitations
The Tweezer Bottom candlestick pattern has its limitations, and it’s important for traders to be aware of these for when you can use it in trading.
The Tweezer Bottom is the same as other candlestick patterns, and it can sometimes generate false signals. so wait for confirmation and believe in your confidence level. also staying informed about market conditions and news events is key to successful trading.
Difference Between Tweezer Bottom Candlestick and Tweezer top
The tweezer top candlestick pattern occurs when the high of two candlesticks are almost or the same after an uptrend same but inverse concept of tweezer bottom.
| Tweezer Top | Tweezer Bottom |
| Tweezer top is considered to be a a short-term bearish reversal pattern. | Tweezer top is considered to be a short-term bearish reversal pattern. |
| This pattern occurs in an uptrend | this pattern occurs in an a downtrend |
| this pattern candles create the same high at the top. | this pattern candles creates the same low at the bottom. |
Final Conclusion
In conclusion, the tweezer bottom candlestick pattern is a useful pattern for all the traders to read charts, Its two candle structure. However, traders should exercise and take caution. Considering its limitations and the need for additional analysis. From the above learnings, this can be employed to track the price movements and spot trades with better risk-reward ratios.
Remember Trading carries inherent risks, and it’s important to trade responsibly and never risk more capital than you can afford to lose. Some people lose their capital without a proper plan execution and psychological issues, and they don’t handle their risk management in crucial situations.
We hope you found this blog informative, Leave a comment below and share your thoughts with LearnX. Your feedback is most valuable!
Happy trading!
Also Read: Morning Star Candlestick Pattern
FAQ (Frequently Asked Questions)
What does the tweezer Bottom pattern Indicate?
This pattern indicates the bullish trend reversal possibilities in the market.
Is tweezer bottom pattern bullish or bearish?
This pattern is considered as a short-term bullish reversal pattern,
Reference: Article of Angle One’s Twizzer Bottom
Reference: Investopedia article of tweezer bottom.


